
Upon entering office nearly eight years ago, Mayor de Blasio vowed to curb traffic deaths and make streets safer for pedestrians. Sadly, this promise has not come to fruition. Instead, traffic deaths have increased, with this year outranking every year since 2013. More and more lives are being lost unnecessarily, and as de Blasio leaves office, he also leaves the streets more deadly than when he entered. At the current rate, a pedestrian is killed by a car on average once every three days in the city.
How Mayor de Blasio’s Promise Started
But where did things go awry? The NY Times map here shows infographics of traffic incidents, specifically where and why cyclists and pedestrians are injured or killed, as of 2014 — de Blasio’s first year in office. The graphics reflect data gathered over the course of 2011-2013, painting a picture of the scene of what de Blasio inherited upon beginning his tenure. The “danger zones” that were identified by the data were “high speed roads, turning cars, wide boulevards, double-parking, and inexperienced drivers.” Also identified were the most dangerous intersections: for example, the most injuries to bicyclists and pedestrians were incurred at Eastern Parkway and Utica Ave in Brooklyn, the second most injuries at Amsterdam Ave and 125th St in Manhattan, the third most injuries and the place where one is most likely to be hit by a bus or a taxi is at 8th Ave and 34th St, and the most bicycle injuries were incurred at Allen St and Delancey St, where traffic from the Manhattan and Williamsburg bridges converge. The most injuries in Queens happened at Northern and Parsons Blvds, and the most pedestrian and bicyclist injuries in the Bronx were at Webster Ave and Fordham Road.
At the beginning of de Blasio’s time in office, he set forth an ambitious vow: to eliminate all traffic deaths by 2024, using a model from Sweden called Vision Zero (aka zero deaths from vehicle-pedestrian accidents). The Swedish model accounts for human error, aiming to accommodate for the inevitable mistakes made by drivers. As one of the originators of the model, Claes Tingvall, described, “design around the human as we are.” The model discounts the usefulness of excessive enforcement and education, and rather utilizes multiple physical barriers (including planters of flowers) and roundabouts, as well as lowered speed limits and automated enforcement (think traffic cameras). Other US states, like Minnesota, Washington, and Utah, which have adopted Vision Zero tactics, have seen dramatic decreases in injuries and fatalities. But, as all New Yorkers know, this city is different to anywhere else in the world. Though Swedes are known for being cautious and polite, that’s not exactly the reputation of New Yorkers. There are other challenges to accommodate too, not the least of which is a larger population. A copy of the city’s original Vision Zero Action Plan from 2014 can be found here.
How It’s Going
Fast-forward to 2021, where does the data stand now? We can take a closer look, thanks to NYC open data. This link takes us to data concerning the different metrics and measures put into place for the Vision Zero initiative.
Speed Limits:
The map below shows speed limit data for the city, noting that the citywide default speed limit (meaning the speed limit unless otherwise posted) was changed in November 2014 from 30 mph to 25 mph. But is this enough? Clearly, with traffic deaths rising, it is not.
Courtesy of NYC Open Data Found Here
Bicycles:
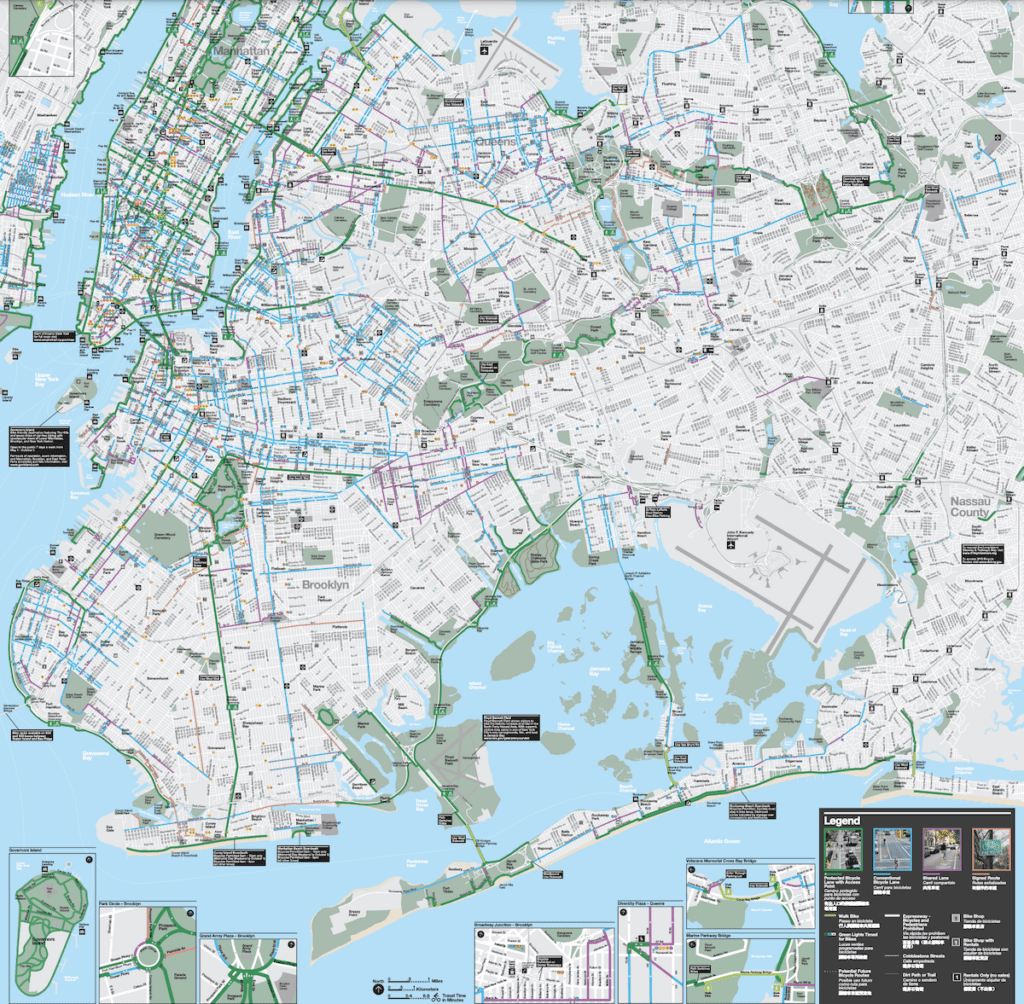
The map below illustrates the zones designated by the city as “Priority Bicycle Districts,” or areas in which there have been relatively high numbers of cyclists killed or seriously injured and where there are few if any bicycle facilities (think bike lanes). There are three of these areas in Queens and seven in Brooklyn, and they have been noted as priority areas for expansion of the bicycle network expansion, as of the “Safer Cycling: Bicycle Ridership and Safety in New York City” 2017 report. No further progress has been noted on the site. We can look below, though, for the updated 2021 Bicycle Map. Comparing the priority zones to the current map, it shows that these areas are pretty lacking: there are very few, if any, dedicated and protected lanes, and only a handful of conventional or shared lanes.
Map of Priority Bicycle Districts Powered by Socrata
Traffic Calming Measures:
This map below shows the locations where traffic calming installations have been added to guide drivers to make safer turns and be more aware of pedestrians.
Courtesy of NYC Open Data Found Here
Number of Accidents Involving Pedestrians and Cyclists:
There have been at least 189 people killed from being struck by a car so far this year (Jan 1-Sept 14), the highest number for this nine-month period since 2013. The details of accident data are found below.
Pandemic Considerations
There are other factors to consider, mainly the pandemic. Mayor De blasio says the pandemic “disrupted a huge amount of progress.” Initially, rates of speeding and reckless driving increased during the pandemic, especially when there were fewer cars on the road. Not surprisingly, through this period, traffic deaths increased nationally as well as in New York, rising 10.5 percent over the previous year. But, as NYC residents opted for private transportation (perhaps looking for safer, less shared airspace), the number of newly registered vehicles significantly increased between September 2020 to the end of August 2021, with 120,000 more cars registered in that 12-month span than in the previous year. And, more vehicles means more traffic. Which also means more traffic deaths. So either way it is spun, whether less traffic or more, the fatalities continue to climb.
Last Thoughts
Clearly, though Mayor de Blasio has started to effectuate plans to make streets safer for pedestrians and cyclists through Vision Zero, there is still much work that needs to be done. Some of the concerns recently raised by residents include: lax enforcement, not enough street redesigns, delayed implementation on approved street redesigns (like the redesign of Queens Blvd, and the Grand Concourse in the Bronx), and a slow rollout of a program targeting reckless drivers. The next mayor will have a steep task, one that will necessitate more fervent measures to protect vulnerable pedestrians and cyclists

Leland is a writer and curator, passionate about the arts and real estate. She especially wants to share clear details about the housing market so that prospective buyers and tenants can make their best-informed decisions.